Learning circle report (September 2018)

~ View progress on Github ~

Problem being addressed

There is value in commemorating learning circles - for P2PU, learners, facilitators, and organizers. Getting information back to people will also create a stronger culture of sharing. We believe that feedback should be gathered in a way that is valuable for those taking the time to participate.

Extra considerations

  • We want to avoid nag campaign and focus on asking people to follow up in meaningful ways.
  • We also want to provide the feedback in reports to users and facilitators in a way that entices them to provide their feedback and prompts other to supply theirs.
  • Render to HTML (web first), but not too much interactivity. Should be possible to .pdf and still be useful.
  • Reports should also integrate with, and be available to access from, facilitator dashboard.

User research

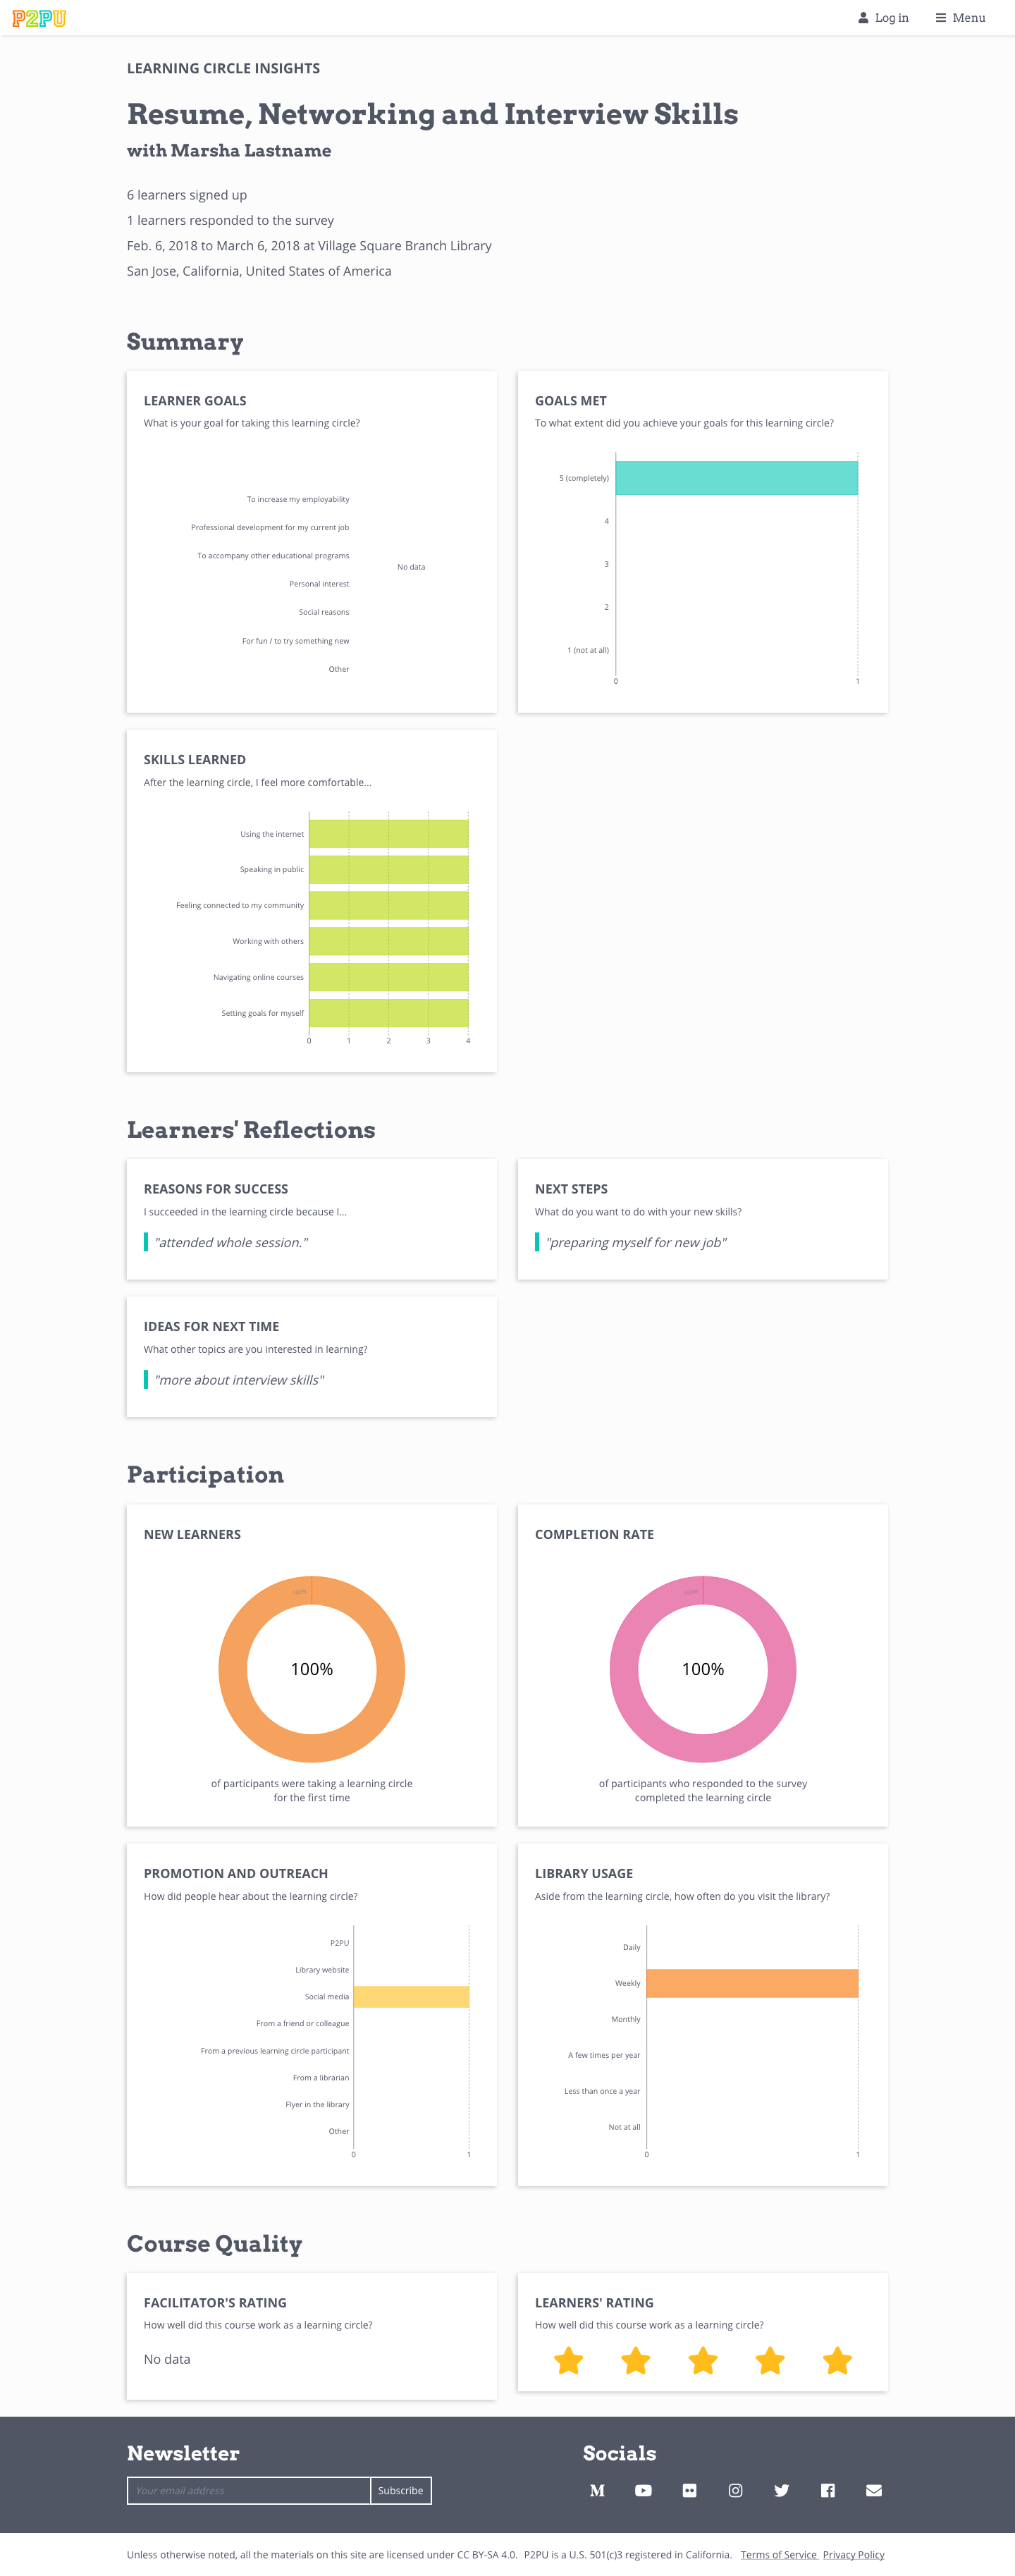
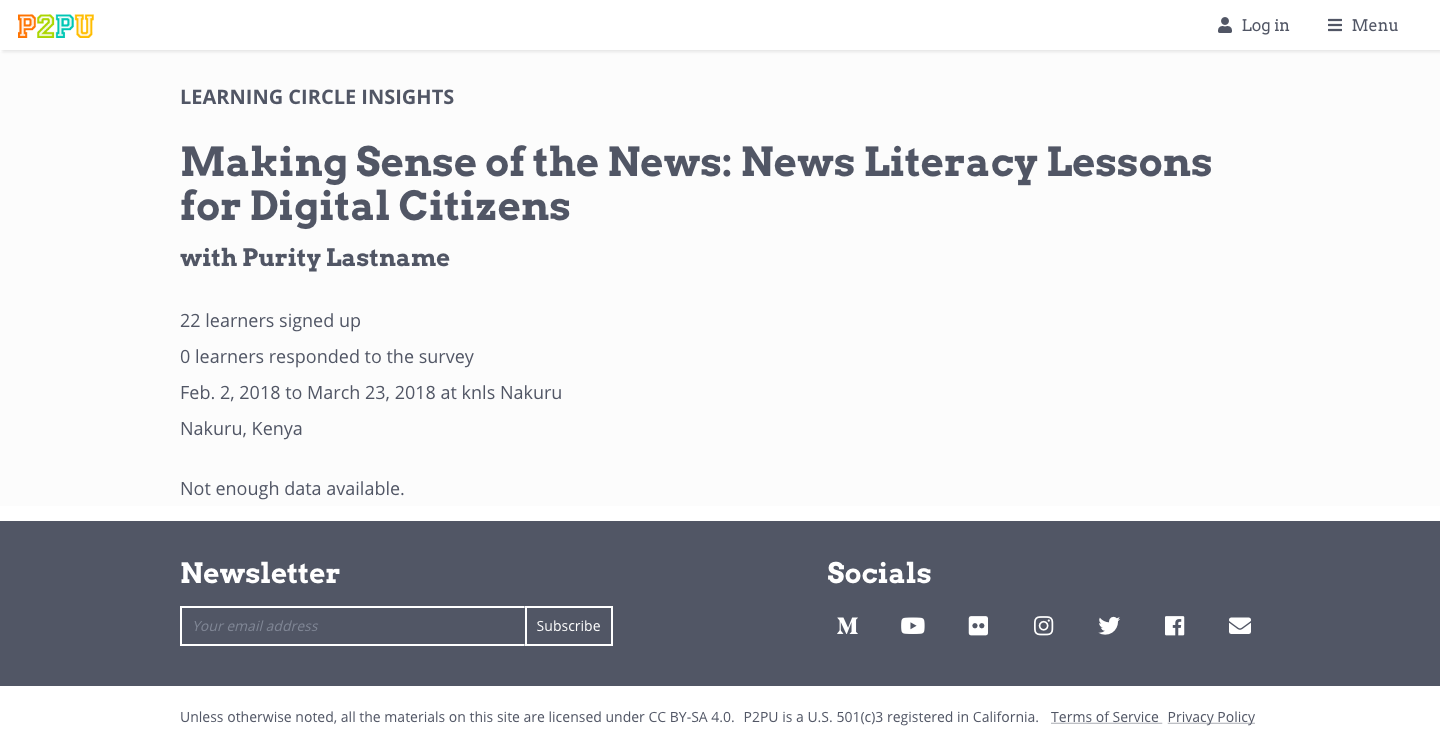
Aggregate mock up reports for a few learning circles that have recently finished, and follow up with learners and facilitators asking for feedback. Once report is implemented, run a follow-up campaign for a few months to solicit feedback and iron out any issues.

Proposed solution

  • 2 days before 2nd to last learning circle meeting, email is sent separately to facilitator and learners asking to leave feedback.
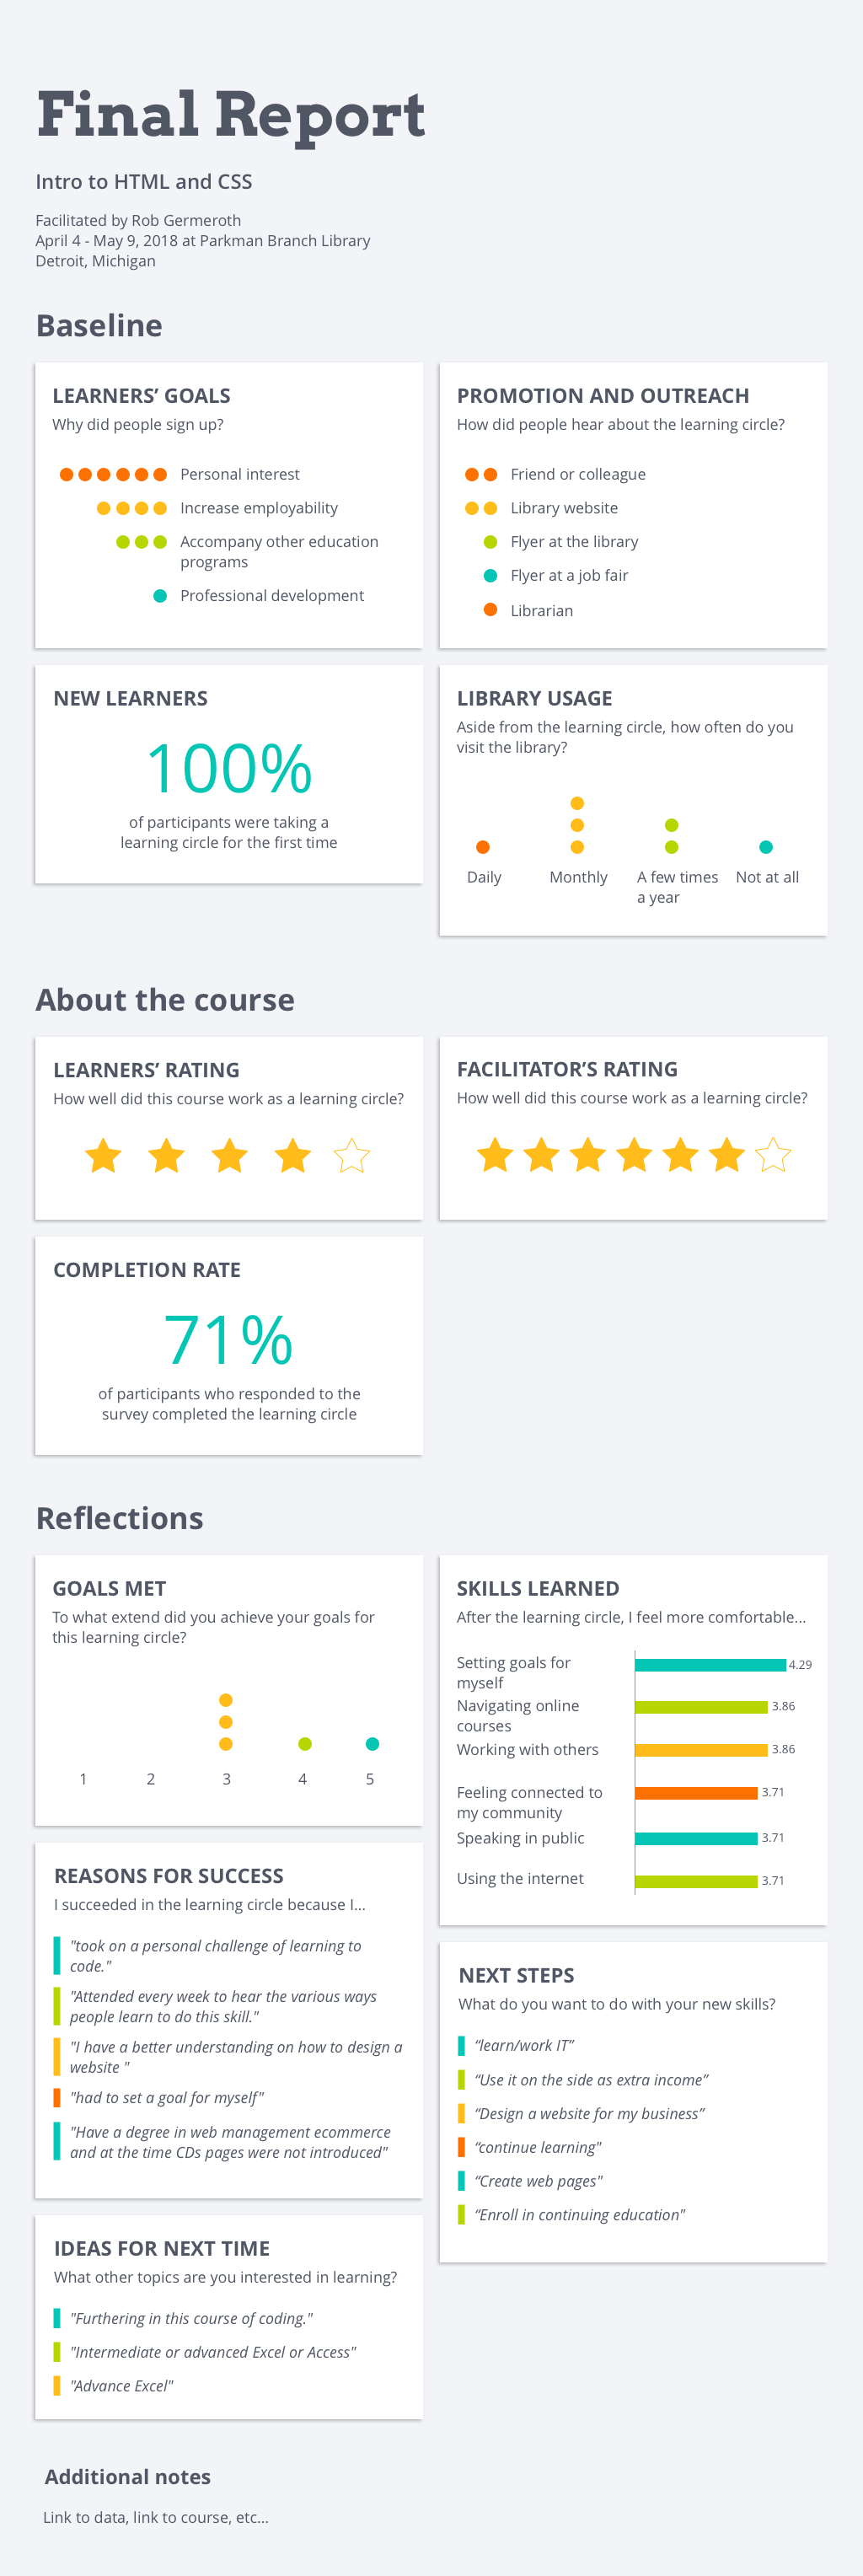
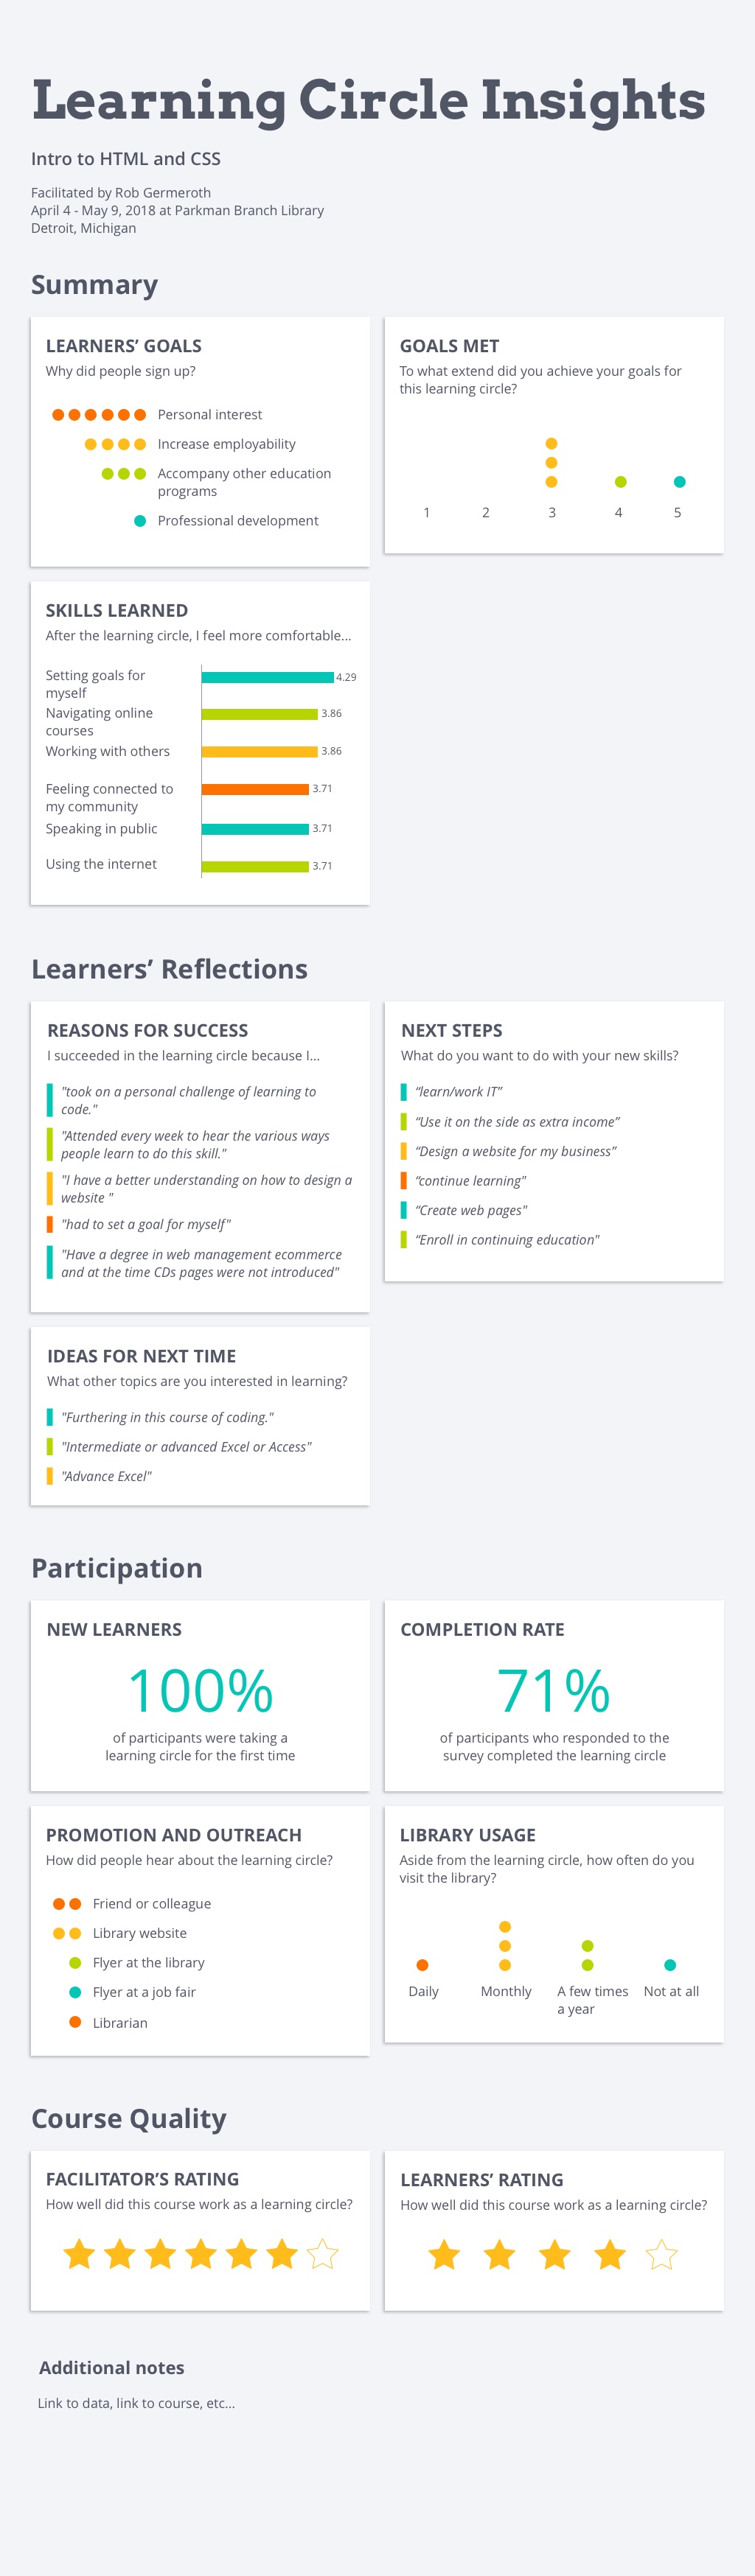
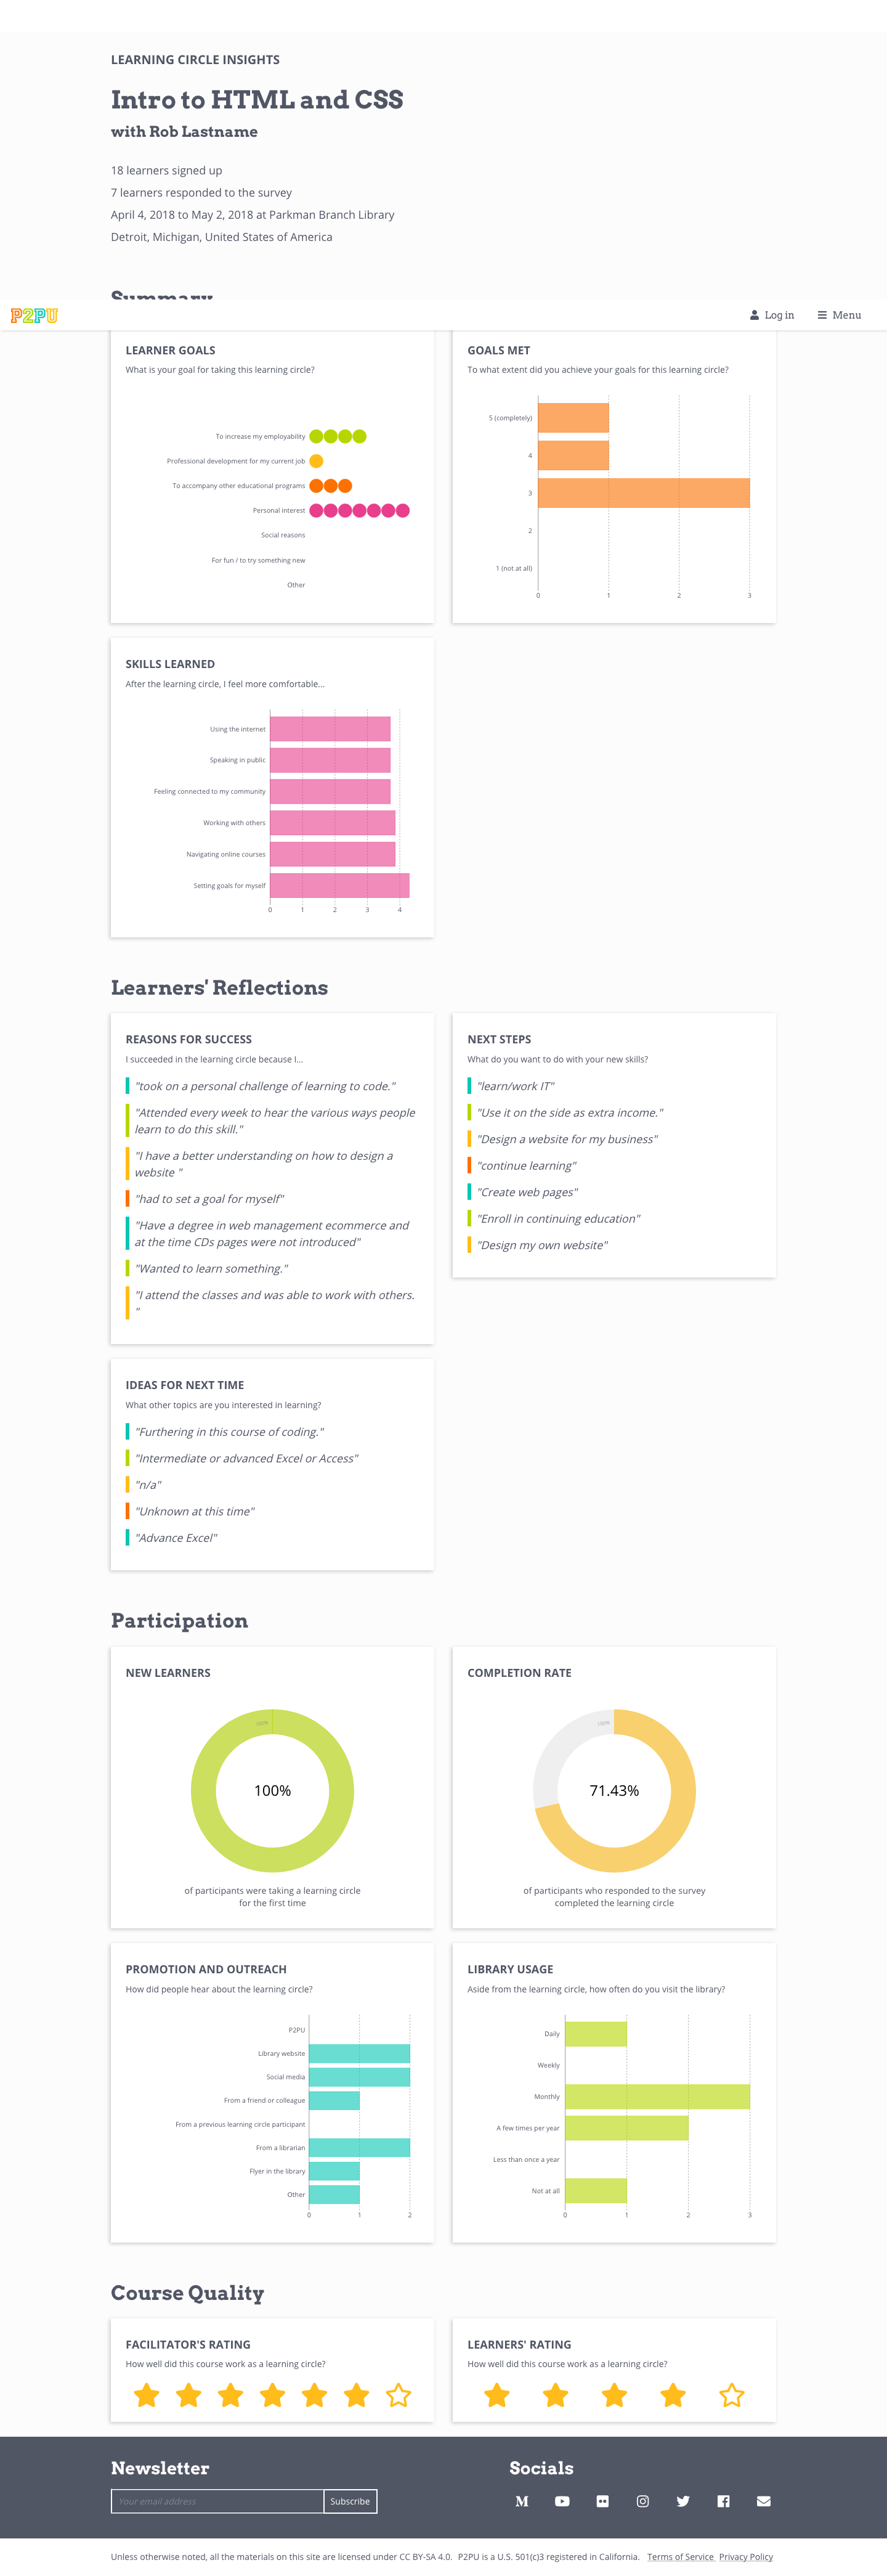
  • Generate report in HTML using all available data from Typeform and learning circle database, push report to facilitator dashboard. Generate graphs as SVG using Python library like Pygal or Plot.ly
  • 2 days before final learning circle, send preview of report as .png to facilitator, with a call to nudge people to participate who have not yet. If nobody has participated, show a sample report.
  • A few days after the final circle, report preview and link to HTML is shared with learner, facilitator, organizer, with final opportunity to leave feedback.
  • Highlight ability to .pdf report from webpage.
  • Develop functionality to aggregate reports by team.

@sharon did this mockup on how the report could look

report-desktop

Hey Dirk and Sharon!
Has this evaluation protocol been implemented yet? I would love to see an after the fact evaluation if it is not ready yet for the circle in Miami closing on Tuesday.
(This is Athy in Miami BTW. Hope you guys are doing great.)

Hi @Athanasia_Fitos! Yes and no. If you use the P2PU signup system, we send survey links to learners for them to fill out a survey. But the report Sharon put together was a manual process, we’re working on automating it.

It doesn’t seem like you’ve had any signups on learningcircles.p2pu.org?

Here’s a new version of the mockup with the charts reorganized. (Open the image in a new tab or download it so you can zoom in.)

report-desktop-v2

You can also download it as a PDF: report-desktop-v2.pdf (100.1 KB)

What does everyone else think?

  1. Who is the intended audience for reports like this? We heard feedback from program managers with large teams that reports like this would be useful to share and promote. We also thought it might be useful for both facilitators and learners as a kind of final report and artifact.
  2. How would you use a report like this?
  3. How does your library internally measure the outcomes and impact of a learning circle?
  4. What format would like you like to see this report? Email, PDF, available through your Dashboard? Is this report ideally public or private?
  5. Are there other pieces of data that you would like to add to a report like this? Photos? Your own personal feedback?

My hope for the survey data would be that it helps us continually make improvements to the way we run LCs. The data in the mockup is great, and useful for “selling” the merits of LCs to patrons and administration, which is important. Looking at it as a facilitator though, I don’t have a ton of insight about how to improve our next group. I’m wondering what people liked/disliked about:

  • the course material,
  • how we interacted with it,
  • the group discussion,
  • the room setup, etc.

I know from experience that it can be difficult to get constructive criticism from surveys, but any chance to get it is worthwhile.

Regarding the report’s design, there were a few things that were unclear to me:

  • Is there any meaning behind the varied colors, or is that just a style thing? The fact that some graphs have repeated colors might falsely suggest a correlation.
  • In the graphs with circles, does each circle represent 1 person? How many people are represented throughout the report?
  • In “Skills Learned,” what do the numbers mean? If this part of the survey uses a Likert scale, a stacked bar chart might be clearer.
  • Why are there different scales for the “Course Quality” ratings?

I think I covered most of your questions in a roundabout way. As far as the format of the report, all of the formats you mentioned would be great. PDF/email would be helpful for the promotional side of things, and having it on the dashboard is useful too.

1 Like

Hi Sharon,

Could you please send a pdf of the mock-up to me via email? I can barely see it on the site.

nailah.mbiti@gmail.com

Thanks!!!

Good point, the image is too small. Here’s the PDF version:

report-desktop-v2.pdf (100.1 KB)

Thanks Sharon…hope you are having a good day! Where in the time zone are you?

P.S. You can also right click on the image and select “Open Image in a New Tab”, where it opens in full size and you can zoom in.

I’m in Toronto, so EST.

Ahhh…I love Toronto when I visited a couple of years ago. Unfortunately I am unable to be on the community call tomorrow, but I will definitely provide some feedback on the site when I’ve had a chance to look at everything.

Ok great! Sorry we’ll miss you tomorrow. Now is the perfect time for feedback - we’ve created the mockups but we haven’t started implementing it yet. So if you have any suggestions for how to improve the report, feel free to share your thoughts here.

I wanted to update you on the progress with the learning circle report. Here’s are some screenshots of what the reports look like with some real responses. To see the images better, right click and open them in a new tab so you can zoom in.

I’d love to hear your feedback!

With 7 responses:
Screenshot_2018-10-15%20Learning%20circles(1)

With 1 response (and no facilitator response):
Screenshot_2018-10-15%20Learning%20circles(3)

And with 0 responses:
Screenshot_2018-10-15%20Learning%20circles(2)

In the facilitator’s feedback, I would like to know to what extent the packaged material was modified.

1 Like